
Every year, tens of thousands of Americans buy a duplex, triplex, or fourplex and move into one unit. I pulled every one of those mortgages from 2018 through 2025 out of the public HMDA data and built this atlas from it. In 2025, that was 46,746 loans, down from a 2021 peak of 70,516. Here is what I found.
The short version
- Conventional loans now dominate: 64.9% of these loans in 2025, up from 51.3% in 2018. FHA fell from 43.9% to 28.2%.
- Low-down-payment conventional loans roughly tripled after Fannie Mae allowed 5% down on 2 to 4 unit homes in late 2023: conventional loans with a combined loan-to-value above 90% and up to 95% went 3,121 (2023) to 9,699 (2024) to 8,858 (2025).
- Buyers need a lot more income: median borrower income rose from $81,000 (2018) to $127,000 (2025), up 57%. Median loan amount rose from about $275,000 to about $425,000.
- Young buyers: 44.5% of 2025 buyers were under 35.
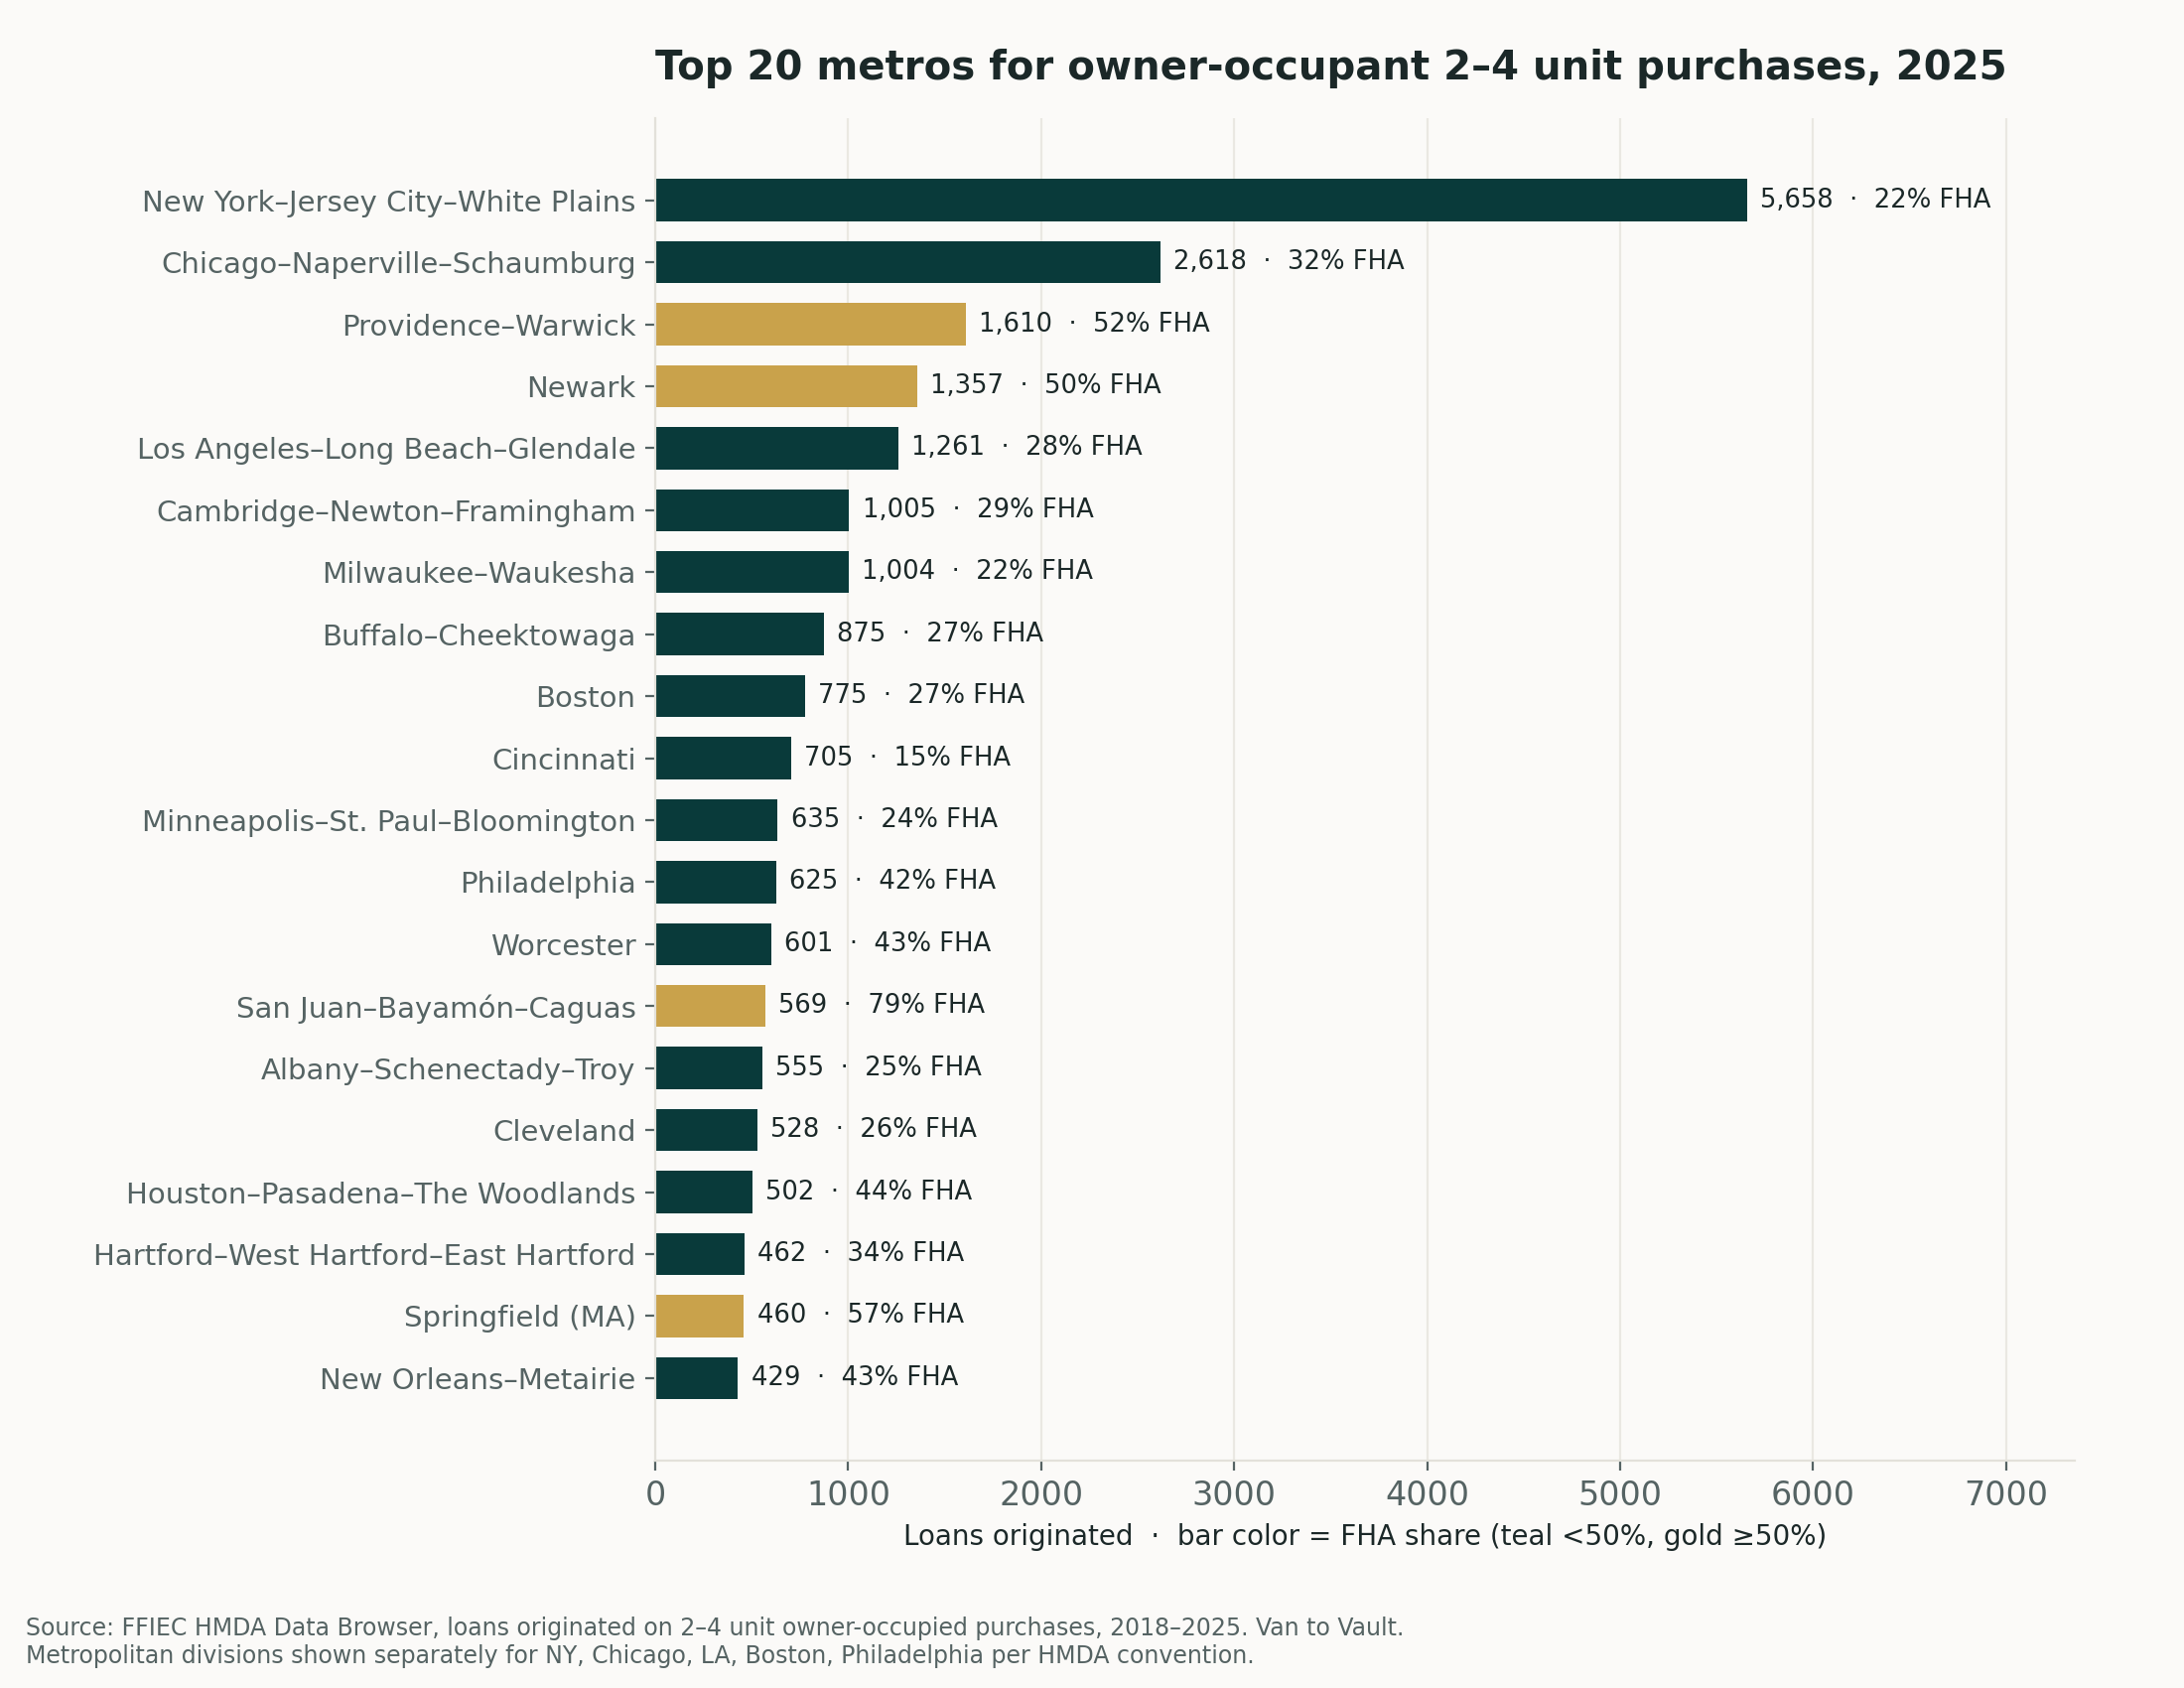
- It’s concentrated in older Northeast and Midwest cities. The New York to Jersey City to White Plains division alone had 5,658 loans, 12% of the national total. Chicago, Providence, Newark, Los Angeles, Cambridge to Newton, Milwaukee, Buffalo, Boston, and Cincinnati round out the top ten.
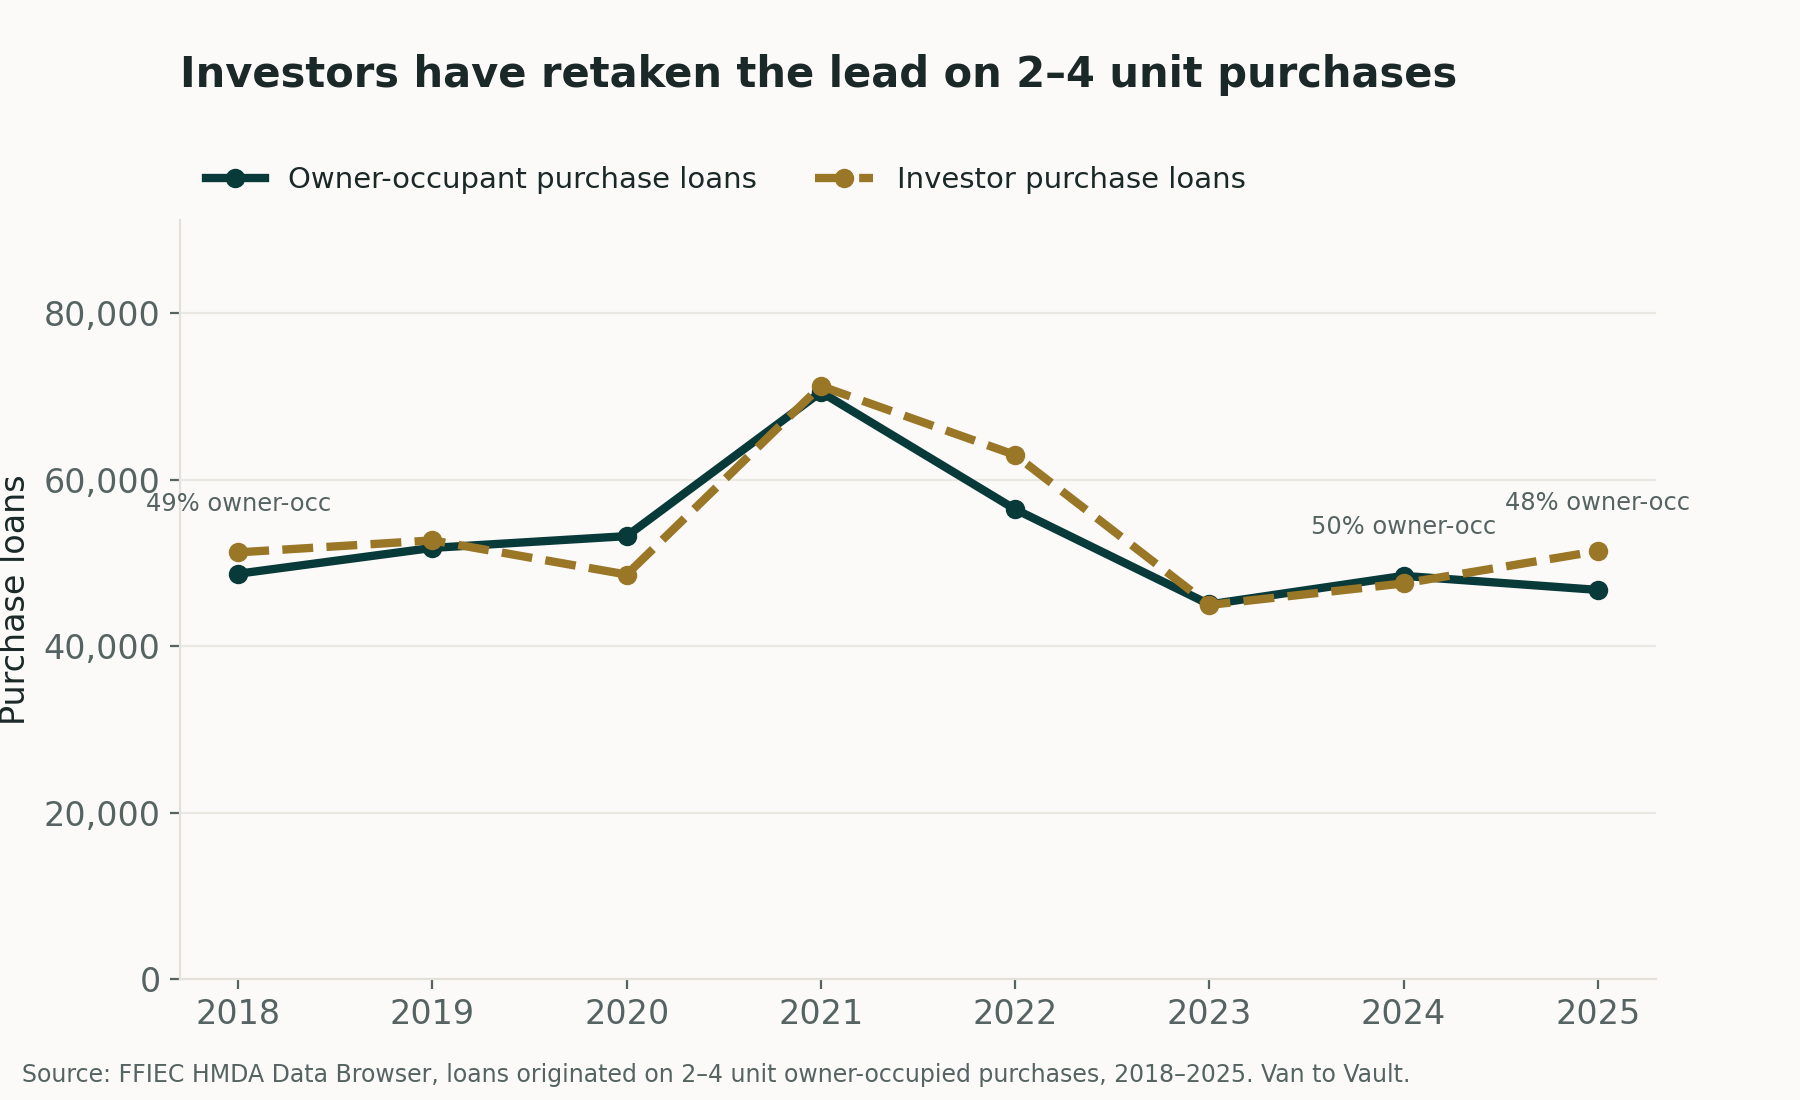
- Investors outnumber live-in buyers again: investors took 51,412 purchase loans on 2 to 4 unit homes in 2025. Owner-occupants were 47.6% of the total, down from 50.5% in 2024.
All figures re-verified against the source data. Filters: action_taken = 1, total_units 2/3/4, occupancy_type = 1, loan_purpose = 1, lien_status = 1. See the methodology page.
Loans by unit count, 2018 to 2025
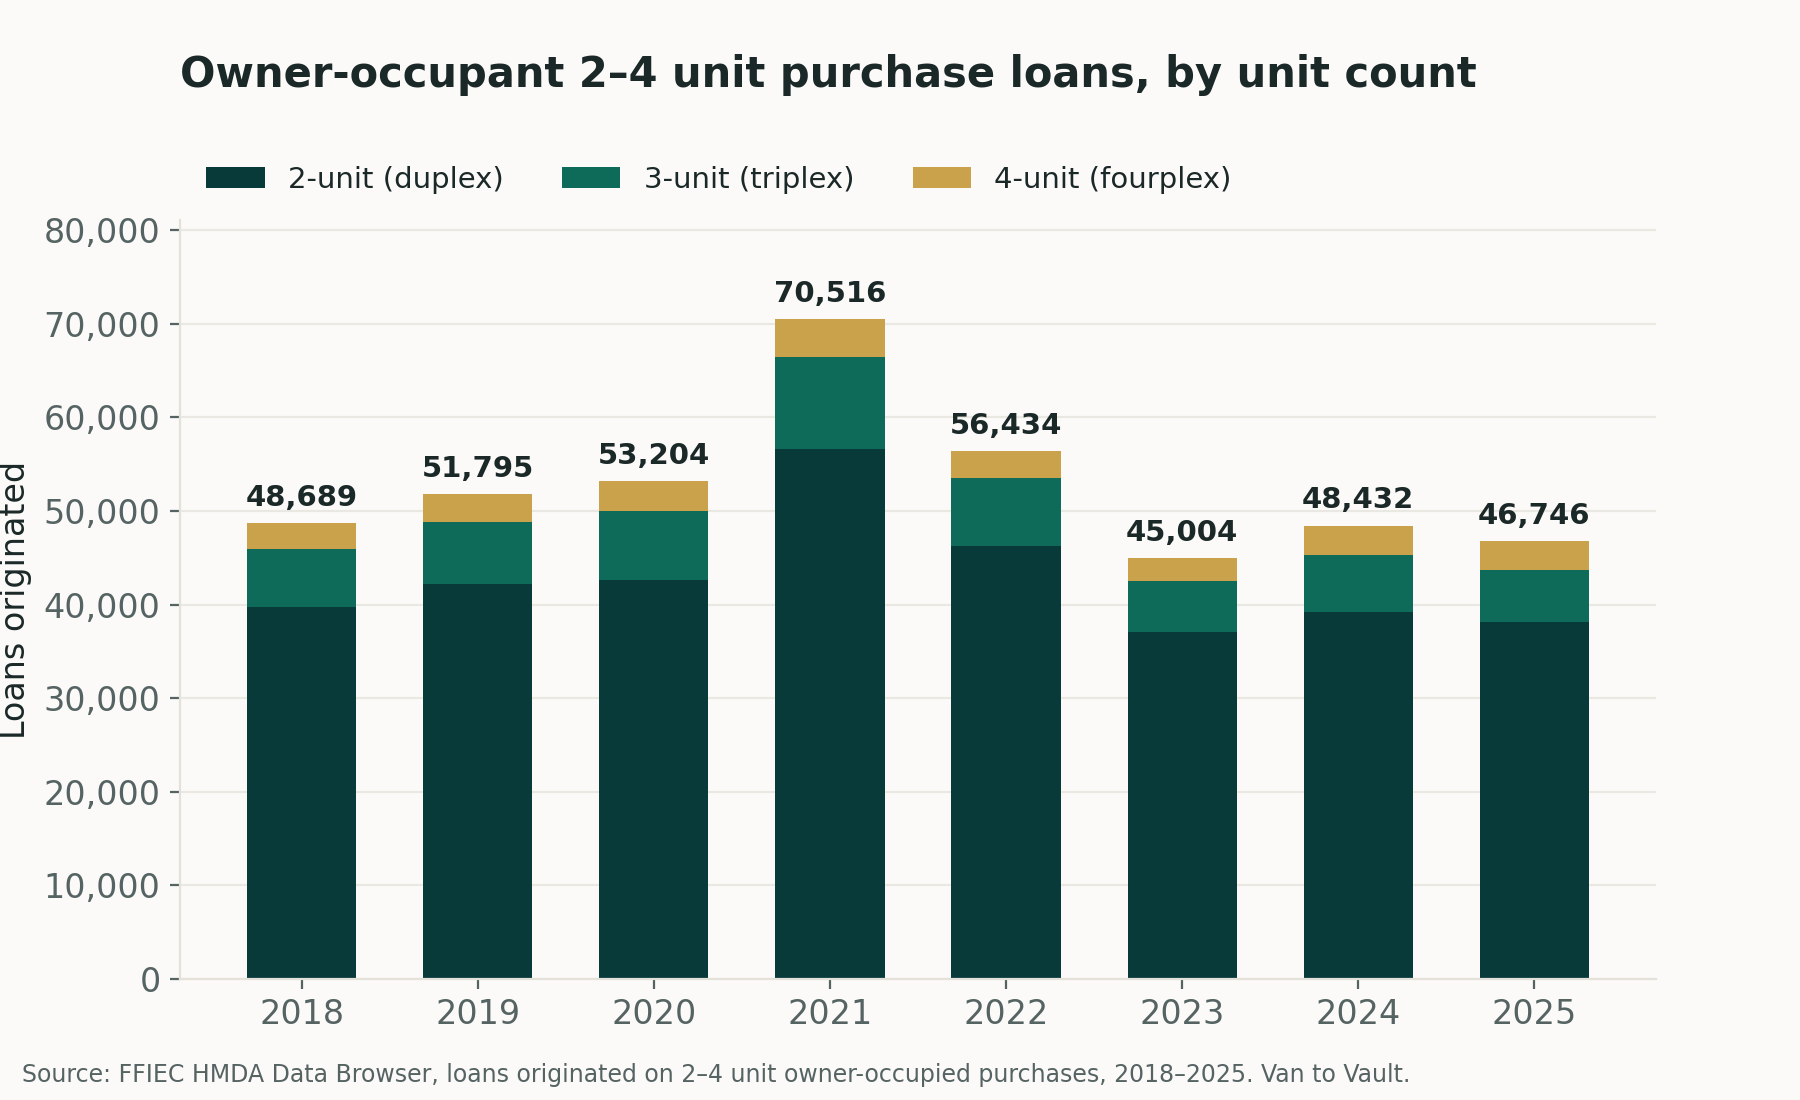
| Year | Total loans | Duplex (2 unit) | Triplex (3 unit) | Fourplex (4 unit) |
|---|---|---|---|---|
| 2018 | 48,689 | 39,757 | 6,146 | 2,786 |
| 2019 | 51,795 | 42,192 | 6,618 | 2,985 |
| 2020 | 53,204 | 42,643 | 7,311 | 3,250 |
| 2021 | 70,516 | 56,603 | 9,884 | 4,029 |
| 2022 | 56,434 | 46,278 | 7,220 | 2,936 |
| 2023 | 45,004 | 37,036 | 5,501 | 2,467 |
| 2024 | 48,432 | 39,171 | 6,084 | 3,177 |
| 2025 | 46,746 | 38,092 | 5,565 | 3,089 |
Two-unit properties make up the large majority of this market every year. The 2021 peak and the pullback since show up across all three unit counts.
Conventional is taking share from FHA
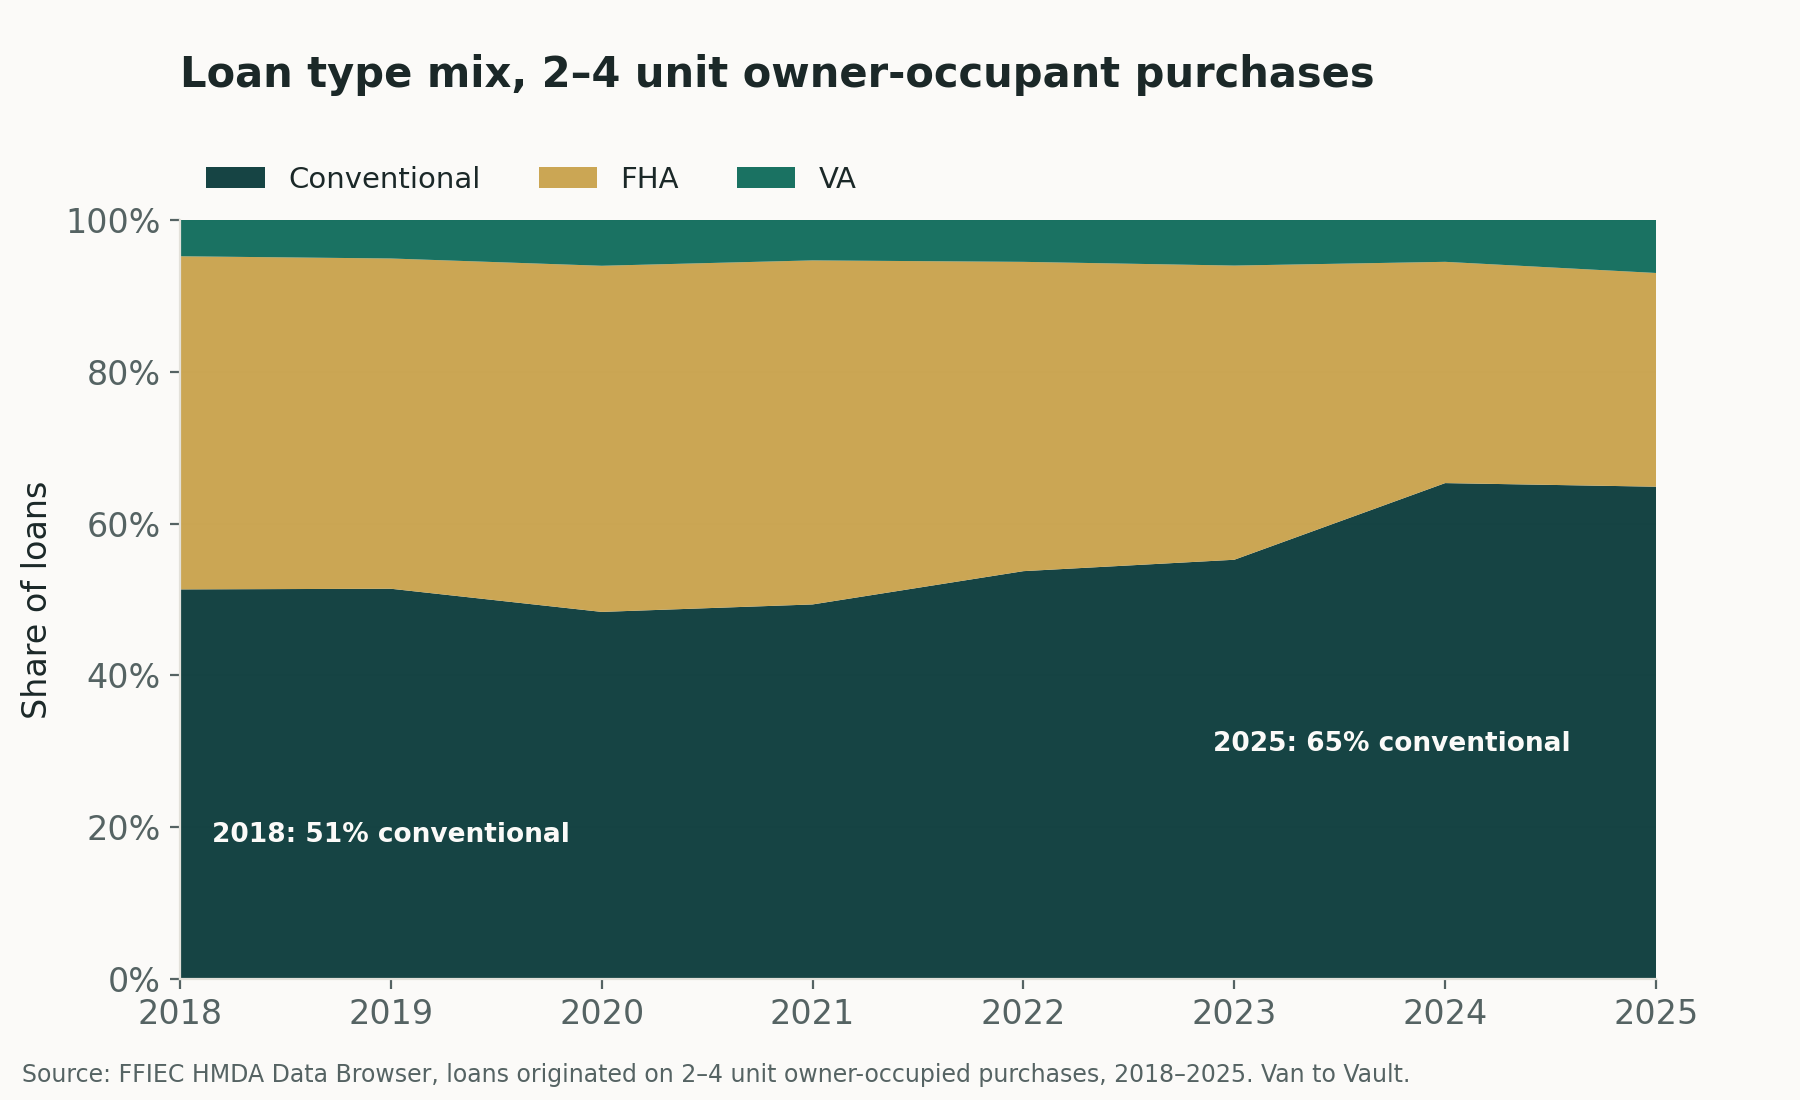
| Year | Conventional | FHA | VA |
|---|---|---|---|
| 2018 | 51.3% | 43.9% | 4.8% |
| 2019 | 51.4% | 43.5% | 5.1% |
| 2020 | 48.4% | 45.6% | 6.0% |
| 2021 | 49.3% | 45.3% | 5.3% |
| 2022 | 53.7% | 40.7% | 5.5% |
| 2023 | 55.2% | 38.8% | 6.0% |
| 2024 | 65.3% | 29.2% | 5.5% |
| 2025 | 64.9% | 28.2% | 7.0% |
Conventional loans went from about half this market to nearly two-thirds in seven years.Loan type mix, 2018 to 2025 HMDA data
The 5% down effect
The catch: before late 2023, putting down less than 10% on a 2 to 4 unit home usually meant FHA. Fannie Mae’s 5% down conventional option for 2 to 4 units, effective November 2023, changed that math for buyers with strong enough credit to qualify conventional.
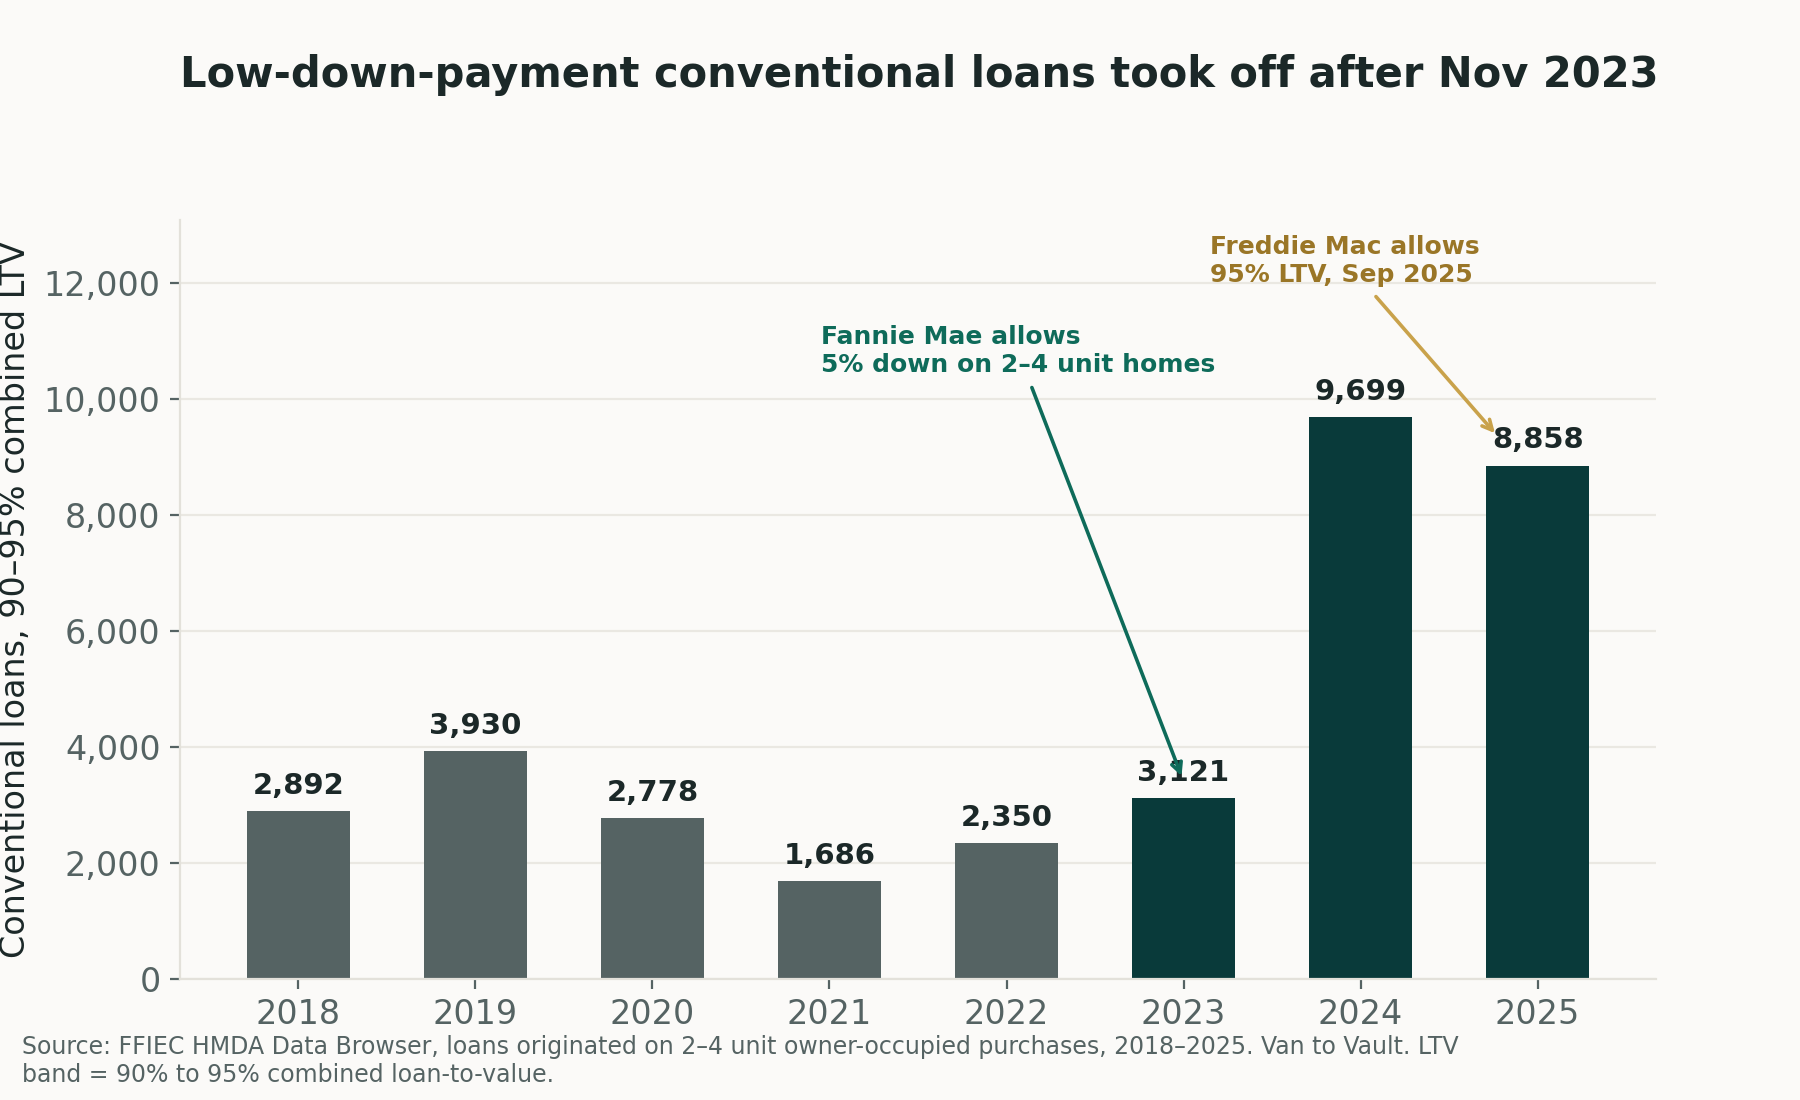
| Year | Conventional loans | At 90 to 95% CLTV (5% down) | Share of conventional |
|---|---|---|---|
| 2018 | 24,989 | 2,892 | 11.6% |
| 2019 | 26,628 | 3,930 | 14.8% |
| 2020 | 25,726 | 2,778 | 10.8% |
| 2021 | 34,793 | 1,686 | 4.8% |
| 2022 | 30,323 | 2,350 | 7.7% |
| 2023 | 24,857 | 3,121 | 12.6% |
| 2024 | 31,643 | 9,699 | 30.7% |
| 2025 | 30,318 | 8,858 | 29.2% |
- Conventional loans with combined LTV above 90% and up to 95%: 3,121 (2023) to 9,699 (2024) to 8,858 (2025).
- That’s roughly a tripling in the year the rule took effect, holding fairly steady since.
You now need $127k to house hack
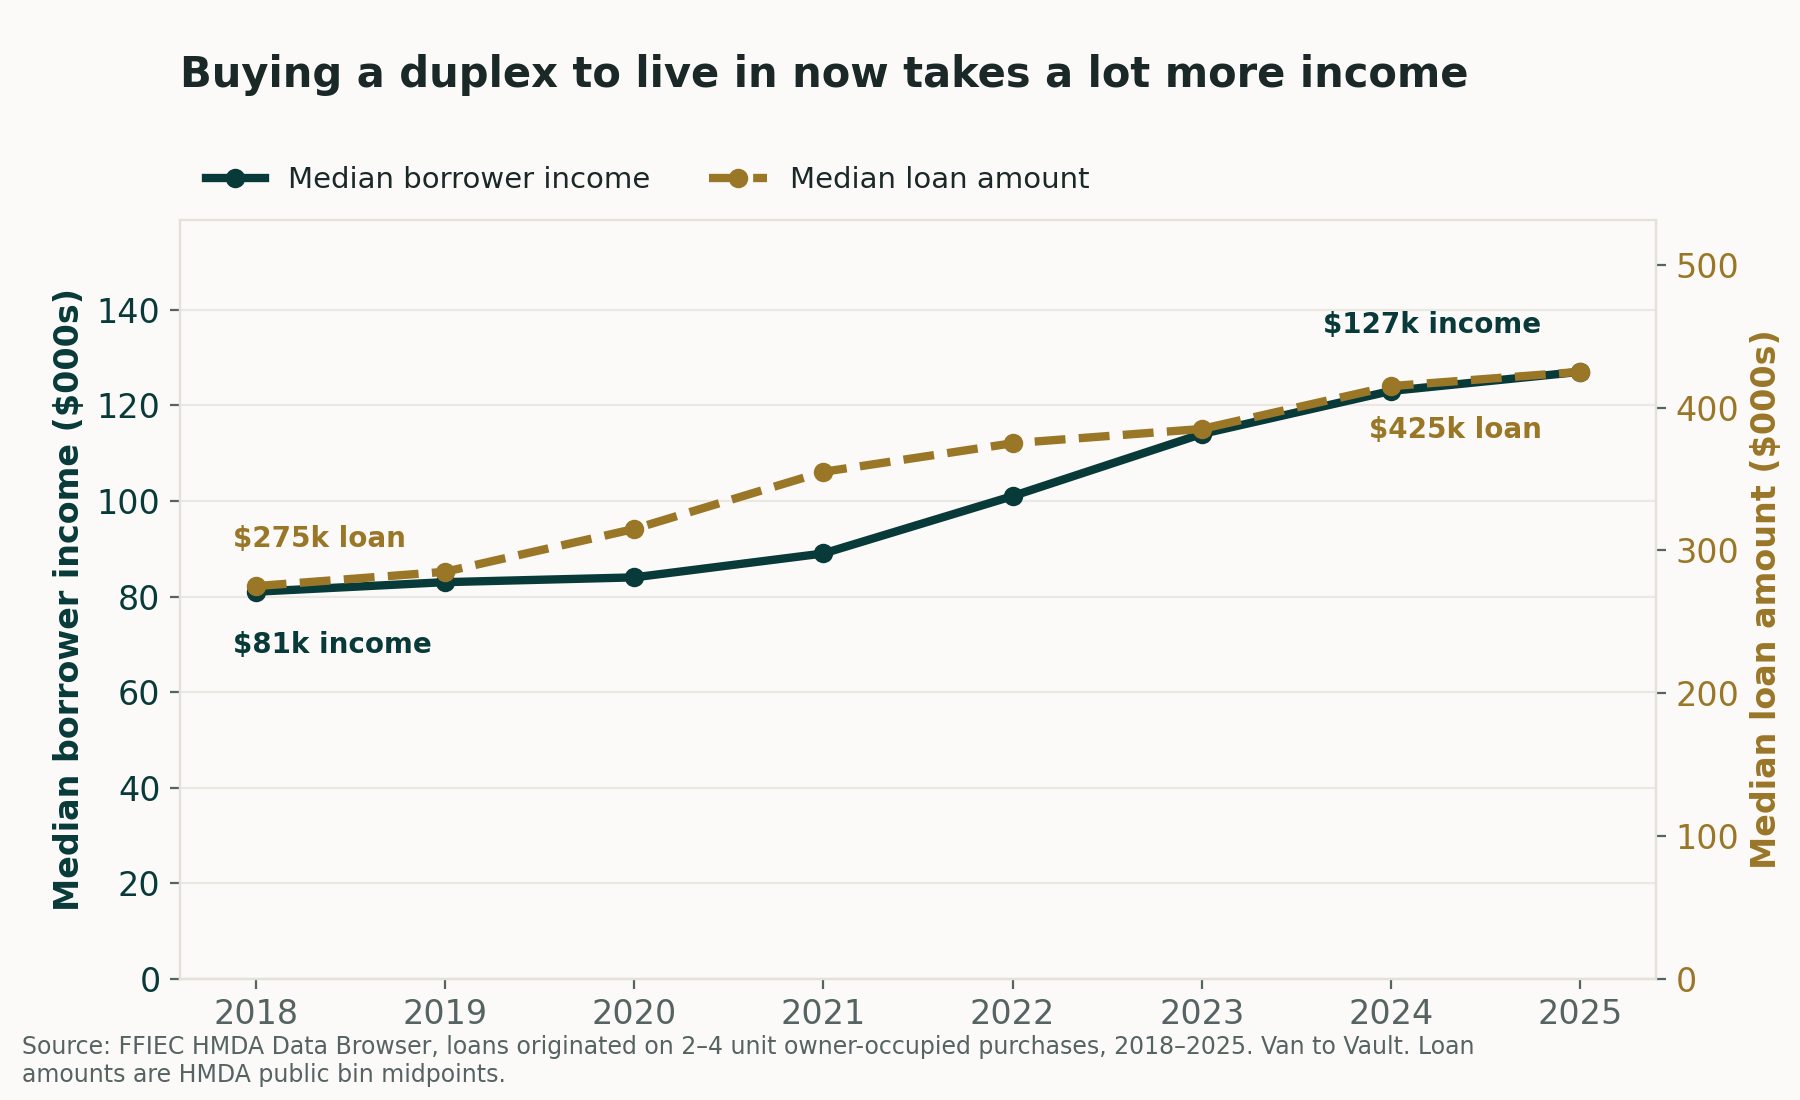
| Year | Median borrower income | Median loan amount |
|---|---|---|
| 2018 | $81,000 | $275,000 |
| 2019 | $83,000 | $285,000 |
| 2020 | $84,000 | $315,000 |
| 2021 | $89,000 | $355,000 |
| 2022 | $101,000 | $375,000 |
| 2023 | $114,000 | $385,000 |
| 2024 | $123,000 | $415,000 |
| 2025 | $127,000 | $425,000 |
Median borrower income on these loans rose from $81,000 in 2018 to $127,000 in 2025, up 57%. Median loan amount rose from about $275,000 to about $425,000 over the same period. This isn’t a story about the same buyer paying more; it’s a market where the buyer profile itself has shifted toward higher incomes.
Top 20 metros, 2025
| Rank | Metro / division (HMDA name) | Loans | FHA share | Median income ($000) |
|---|---|---|---|---|
| 1 | New York to Jersey City to White Plains | 5,658 | 22% | 189 |
| 2 | Chicago to Naperville to Schaumburg | 2,618 | 32% | 121 |
| 3 | Providence to Warwick | 1,610 | 52% | 128 |
| 4 | Newark | 1,357 | 50% | 162 |
| 5 | Los Angeles to Long Beach to Glendale | 1,261 | 28% | 213 |
| 6 | Cambridge to Newton to Framingham | 1,005 | 29% | 176 |
| 7 | Milwaukee to Waukesha | 1,004 | 22% | 84 |
| 8 | Buffalo to Cheektowaga | 875 | 27% | 75 |
| 9 | Boston | 775 | 27% | 186 |
| 10 | Cincinnati | 705 | 15% | 118 |
| 11 | Minneapolis to St. Paul to Bloomington | 635 | 24% | 108 |
| 12 | Philadelphia | 625 | 42% | 99 |
| 13 | Worcester | 601 | 43% | 125 |
| 14 | San Juan to Bayamón to Caguas | 569 | 79% | 55 |
| 15 | Albany to Schenectady to Troy | 555 | 25% | 87 |
| 16 | Cleveland | 528 | 26% | 86 |
| 17 | Houston to Pasadena to The Woodlands | 502 | 44% | 131 |
| 18 | Hartford to West Hartford to East Hartford | 462 | 34% | 102 |
| 19 | Springfield (MA) | 460 | 57% | 94 |
| 20 | New Orleans to Metairie | 429 | 43% | 115 |
Metropolitan divisions split the largest metros (New York, Chicago, Los Angeles, Boston, Philadelphia). Loans outside any metro area (4,236 in 2025) aren’t ranked. Sum of the top 20: 22,234 loans, 47.6% of the national total.
A diverse buyer base
Hispanic borrowers held 22.5% of 2025 owner-occupant 2 to 4 unit purchase loans, up from 20.2% in 2018. Black borrowers held 14.6%, up from 13.0% in 2018.
A caveat on the comparison. I wanted to hold that up against all home buyers nationally, but the public HMDA tool I use for this atlas won’t combine a purchase-loan filter with a race or ethnicity filter; it returns an error every time. The closest number it will give me is race and ethnicity shares of all 2025 mortgage originations of any purpose and any property type nationwide: Hispanic borrowers were 10.65% of that broader group, Black borrowers were 6.77%. That population includes refinances and single-family homes, so it’s not an apples-to-apples match with the purchase-only, 2 to 4-unit figures above. Treat this as a directional comparison, not a precise one.
This data can’t show approval odds or pricing fairness, and I’m not making any lender-fairness claim here. See the methodology page for what HMDA data can and can’t tell you.
Investors are back on top
| Year | Owner-occupant loans | Investor loans | Owner-occupant share |
|---|---|---|---|
| 2018 | 48,689 | 51,253 | 48.7% |
| 2019 | 51,795 | 52,694 | 49.6% |
| 2020 | 53,204 | 48,588 | 52.3% |
| 2021 | 70,516 | 71,238 | 49.7% |
| 2022 | 56,434 | 62,954 | 47.3% |
| 2023 | 45,004 | 44,938 | 50.0% |
| 2024 | 48,432 | 47,521 | 50.5% |
| 2025 | 46,746 | 51,412 | 47.6% |
| Group | 2025 loans | 2025 share | 2018 share | Change |
|---|---|---|---|---|
| White | 26,605 | 56.9% | 65.5% | -8.6 pts |
| Race not available | 7,832 | 16.8% | 10.0% | +6.7 pts |
| Black or African American | 6,813 | 14.6% | 13.0% | +1.6 pts |
| Asian | 3,828 | 8.2% | 9.0% | -0.8 pts |
| Joint | 996 | 2.1% | 1.6% | +0.5 pts |
| American Indian or Alaska Native | 383 | 0.8% | 0.4% | +0.4 pts |
| Two or more minority races | 182 | 0.4% | 0.2% | +0.2 pts |
| Native Hawaiian or Other Pacific Islander | 102 | 0.2% | 0.3% | -0.1 pts |
| Hispanic or Latino (ethnicity, counted separately) | 10,502 | 22.5% | 20.2% | +2.3 pts |
Owner-occupants’ share of 2 to 4 unit purchase loans slipped to 47.6% in 2025, down from 50.5% in 2024. Investors took 51,412 purchase loans on these properties in 2025, more than live-in buyers, for the first time since I started tracking this.
Methodology, in short
This atlas counts mortgages used to buy a 2-, 3-, or 4-unit home where the borrower said they’d live there, people often called house hackers. Source: the public HMDA data most US mortgage lenders report every year. Full filters, definitions, and what this data can’t tell you: see the methodology page.
If you’re weighing whether a duplex, triplex, or fourplex pencils out for you, see what I’ve built to help on the products page.
Sources: HMDA public data, FFIEC/CFPB. Van to Vault (vantovault.com), 2 to 4 Unit Owner-Occupant Lending Atlas, 2025.
Reuse this data
Last updated: September 17, 2026. Data as of: the 2025 HMDA release, the most recent year available.
Cite as: Van to Vault (vantovault.com), 2-4 Unit Owner-Occupant Lending Atlas, 2018 to 2025. Compiled from HMDA public data, FFIEC/CFPB.
Every table and chart on this page is published under a Creative Commons Attribution 4.0 International license (CC BY 4.0). Republish them, chart them, quote them. All I ask is a credit and a link back. The underlying HMDA data is public and produced by the FFIEC and CFPB.
Get started with the newsletter!
Useful, relevant analysis, tools, tricks, and what you need to know on the journey to financial freedom. From the van years to a duplex, the plain math and none of the hype.
Subscribe and get the free $0-to-First-Property Roadmap to start.
No spam. Unsubscribe in one click.
Want the deeper toolkit? The guides and spreadsheets are in the shop, from $5, and the free tools stay free either way.